Economy

Farm Bankruptcies in Georgia Jump


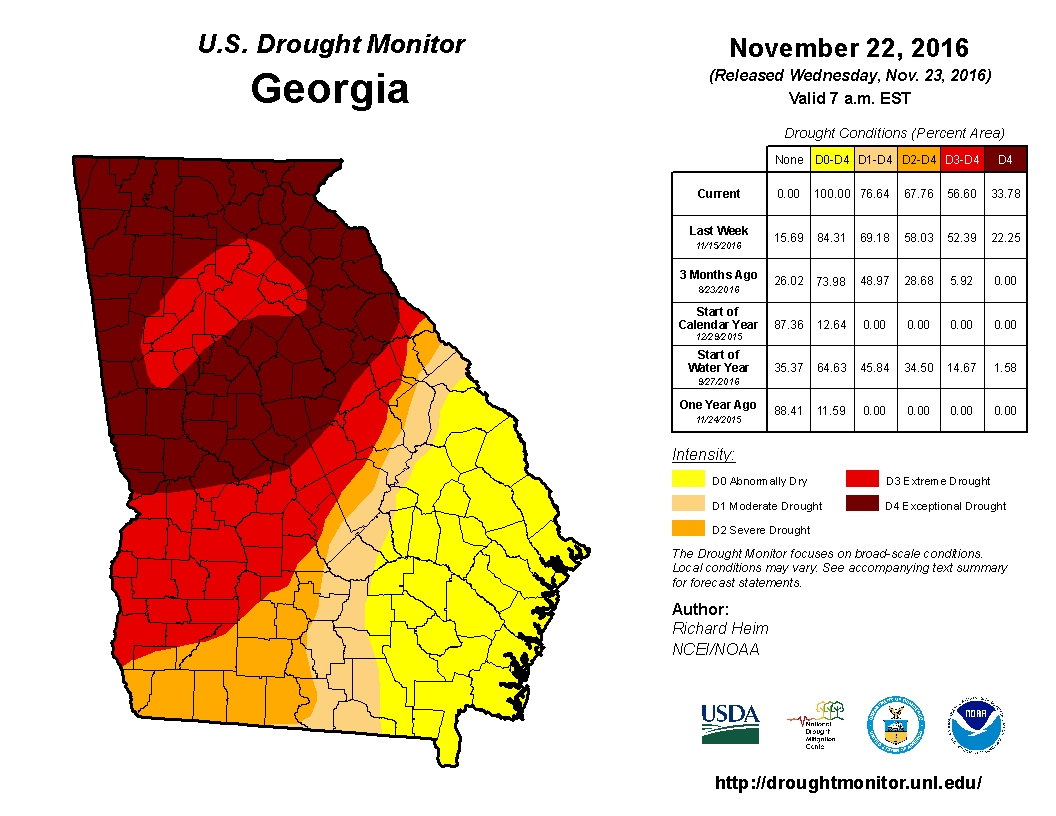
The Farm Bureau article on national bankruptcy trends for agricultural producers has been making the rounds, and the number for Georgia — at 37 tied for second most behind Wisconsin — stick out. Wisconsin’s ranking likely owes to the troubles that have shaken the dairy industry of late. (In fact, Dean Foods, the nations’ number one milk producer, just filed for bankruptcy.) The situation in Georgia is a striking contrast against neighboring states, and perhaps it shows the impact of the “trade war” on cotton producers and even the lasting damage of Hurricane Michael.

But there are some things to consider:

  • Per the AJC, the number of farmers who filed for Chapter 12 through September 30 is up 12 from the same period in 2018. However, that amount was 43 and 41 in the two previous years.

  • Georgia is doing fine in Market Facilitation Program (MFP) payments, that series of magical remunerations for farmers’ sacrifice during the “trade war” with China. To date, Georgia has received $151,605,594.10. By comparison, Alabama has only gotten $55,610,083.70

  • On November 15, Secretary Perdue announced a second tranche of MFP payments to be paid starting the week of Thanksgiving. For producers of MFP-eligible commodities, this now covers 75% of the potential total payment from MFP. For reference, MFP will provide as much as $14.5 billion in direct payments to farmers.

  • The USDA will consider issuing a third round of MFP payments based on market conditions. You can take it to the land bank that this will happen. That Farm Bureau article estimates that 40% of farmers’ income (i.e. $33 billion) “is related to trade assistance, disaster assistance, the farm bill and insurance indemnities.” In a year of bad weather, these payments are helping keep farms afloat. The only question is when. Farmers will need them ASAP to fund and finance 2020 crops. But political cycle may hold them up until it’s most advantageous for Trump’s reelection campaign.


In the midst of the storm and stress around farm bankruptcies and hard times in the heartland, it’s worth considering concentration in the industry and the growth of mega farms, for good or ill.

Five percent of all farms produce 75% of all sales, and the trend line is falling. These figures come from Brent Gloy of Agricultural Economic Insights using data from the USDA NASS Census of Agriculture.


Interestingly, Gloy points out that these large farms are also responsible for a disproportionate amount of Certified Organic production. Out of a total of $7.27 billion, 43 had organic sales of $1.3 billion and 945 had sales of $4.6 billion. In other words, less than a thousand farms account for over 60% of all organic sales.

Getting the Farm through 2017

cashreceiptsselectedcrops.jpg

My story on the 2017 economic outlook is up at Growing Georgia. Many thanks to Kent Wolfe, Director of the University of Georgia Center for Agribusiness and Economic Development, and Brady Brewer, Assistant Professor of Agricultural and Applied Economics, for their time. 

Much of the advice from the experts should be obvious for any business operator: know your costs to operate and reduce them in whatever possible. However, as a farmer, there are some agronomic limitations, where revenue opportunity may come at the expense of long-term soil and plant health. I particularly like Brewer's suggestions about diversifying debt, but his recommendation to "get to 2018 with the least amount of damage" also sticks out.

Some of Brewer's comments are copied here for background:


"What we've been advising farmers is now is one of the most important times to know your cost of production. We're starting to transition farmers to where they keep accurate records. They know their input costs and exactly, down to the penny, what it takes to grow a certain crop. But that is our number one recommendation: Knowing your cost of production, what it is going to cost you is step one. Step two is choosing the crop that you think is the sure bet to cover your cost of production. … Different crops bring different risk levels, either through price risk or production risk. Certain crops take more water. Other crops might have historically variable prices. On the output side, those crops might be good in the good times when there's not much chance of going negative. But in times of lean margins, now might not be the time to take those risks. Once you know your cost of production, it's essential to pick the crop that, barring a complete catastrophe, you now is going to get you through this production year. … Let's get to 2018 with the least amount of damage." 

"Take the peanut for example. Due to certain pests, whether it be nematodes or fungus, it's a crop where you don't want to mess a whole lot with the rotation. However, with that said, we have seen some farmers start to tweak their rotation a little bit. Now obviously you can't just go completely away from it. But any tweak that you can do or any slight change is going to help you. Agronomically, if you're at a certain point in your rotation you can't just go completely away from it, but farmers have shown pretty good resiliency in being able to plant a little bit extra of a certain crop in the rotation and take away from another crop in the rotation. Any acre planted to something that is going to help you persevere is going to be better. … You have to think about the long-term so that if you do persevere through the next year, you don't want to completely ruin your soil agronomically. But any tweak is going to help." 

"The strong dollar is not helping us from an economic standpoint. The oversupply of corn and soybeans is really hurting the price for those two commodities. Peanuts and cotton are going to be more demand drive than corn and soybeans. But on the world market just because of the strong dollar, that demand is going to elsewhere just because it's cheaper to find those commodities elsewhere on the international stage. The two commodities that aren't oversupplied — cotton and peanuts — are being hurt by the strong dollar."

"When you speak with bankers they understand what's going in the industry of agriculture right now. They know that farmers' cash flows are tight, and they don't expect a farmer to walk in and say I'm planning for another bumper crop years … They know they're going to have some farmers coming after money, and that money may turn into a negative net loss. What they want farmers to have is a plan in place. Budgeting is going to be essential. If a farmer can go into the bank and say look, this is what my cost of production is, this is what — worse case scenario — I expect to receive at the market. It doesn't look too good, but the good news is that I have some working capital and I'm going to be able to pay you at the end of the year, or most of it. Bankers are going to understand that. From a risk standpoint, I always advise farmers to have multiple lending relationships. Any time you can diversity your banking portfolio, it's going to increase the chances that you keep receiving your lines of credit from lenders. Different lenders have different risk appetites. The more you have, the higher the probability there is that you're going to keep receiving the credit you need."

Georgia's Drought Impacts Cattle Production

If you want to see a clear sign of the effects of the 2016 drought, look no further than livestock auction receipts for the week of November 11. Georgia cattlemen took 3,600 more cattle to the sale than they did during the same period in 2015. That's an increase of over 46 percent. For the year as a whole, 5,600 more head have hit the auction, obviously a large part of that coming in the latter half of the year as pastures quickly degraded.

Chart, forage conditions, and November 22 drought map are below. Praise the Lord we've had some rain in December.

Cattle and Calves Receipts

Data from 20 Georgia auctions. Source: Georgia Cattleman, December 2016

Pasture Conditions Weed Ending 11/13/2016

Source: USDA NASS
Georgia Drought Nov. 22

Divergent Land Values in Midwest, Southeast

Source: USDA NASS

Source: USDA NASS

My little story on land values and land rents in the agricultural economic downturn is up over at Growing Georgia. It's a quick read (hint: Southeast prices are holding on). What's not there, however, are all of the supporting graphs. There are also some highly important maps that show the fundamental ways that Midwest farming and Southeast farming are structured differently. In short, farmers in the Corn Belt rent a lot more land, which — just by sheer numbers — makes them more likely to walk away from land with high cash rents. Farmers in the Southeast, particularly Georgia, have more irrigation and a lot more investment in their fields. That land is a pretty sure bet to produce and too expensive to set aside. 

Maps and data are below:

Source: USDA NASS, 2012 Census of Agriculture

Source: USDA NASS, 2012 Census of Agriculture

Source: Changes in Southern Cotton and Peanut Producing Regions, Shelbi R. Knisley, USDA-ERS

Source: Changes in Southern Cotton and Peanut Producing Regions, Shelbi R. Knisley, USDA-ERS

Source: 2015 Farmland Value Survey, Iowa State University, University Extension

Source: 2015 Farmland Value Survey, Iowa State University, University Extension